
服务追踪,我们使用SpringCloudSleuth和Zipkin做服务追踪
前言
有时候,我们订单服务创建订单时候耗时很严重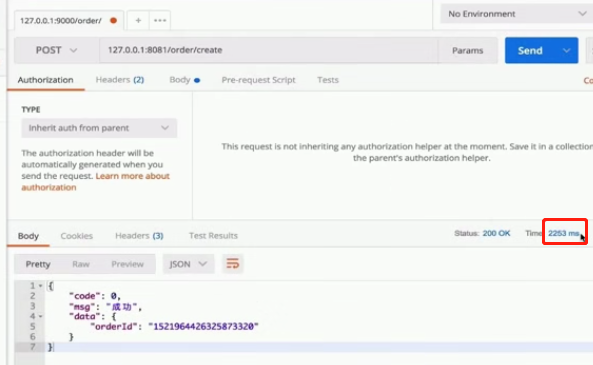
以上订单花费了2.2秒,耗时很严重。到底问题出现在哪里呢?可能是下单时候调用product服务获取商品信息时候耗时比较严重。也可能是扣库存地方耗时比较严重,那我们如何确认是哪个接口耗时比较严重呢?一般我们是通过计时:在调用之前计时,在调用之后计时,这样就得出结论来了。假设已经定位出问题是调用商品服务返回商品信息耗时严重,此时我们就会通知此接口开发者解决,但是获取商品信息接口又是调用了其他服务,
就像上面的服务:A调用B,B调用C,这是一整套链路,当服务调用越来越多,链路越来越长时候,通过日志计时打点效率非常低而且排查起来不方便,这就牵涉到服务追踪。我们要做的其实就是链路监控。
10.1 服务追踪
针对于链路监控,SpringCloud提供了非常方便的组件:Spring Cloud Sleuth,Sleuth是侦查,链路监控这一章节,要写的东西并不多,主要是要会看。
10.1.1 使用SpringCloudSleuth
- 1.引入依赖
|
- 2.使用postman请求:
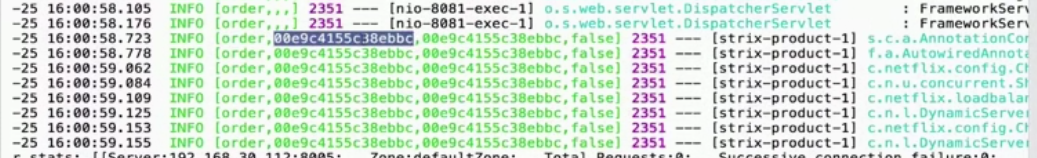
从上图我们知道:
a.第一列:order->代表order服务
b.第二列:代表traceId(链路id);一条链路里面最多包含一个id,也就是说traceId是一条链路的唯一标识。
c.第三列:spanId,是一个基本单元;一条链路里面可以包含多个spanid,spanid可以理解成最基本的工作单元。
d.第四列:true表示要把这些信息输出到其他服务搜集和展示,false就是不搜集。
我们现在在本地配置文件中将日志级别改为debug模式
|
|
此时展示出更多的日志:
2019-12-15 08:15:41.058 DEBUG [order,dc93086b3bb2856a,eec9e8de8adb4274,false] 16616 --- [strix-product-2] o.s.c.openfeign.support.SpringEncoder    : Writing [[DecreaseStockInput{productId='157875227953464068', productQuantity=2}]] using [org.springframework.http.converter.json.MappingJackson2HttpMessageConverter@d43328]
Hibernate: select ordermaste0_.order_id as order_id1_1_0_, ordermaste0_.buyer_address as buyer_ad2_1_0_, ordermaste0_.buyer_name as buyer_na3_1_0_, ordermaste0_.buyer_openid as buyer_op4_1_0_, ordermaste0_.buyer_phone as buyer_ph5_1_0_, ordermaste0_.create_time as create_t6_1_0_, ordermaste0_.order_amount as order_am7_1_0_, ordermaste0_.order_status as order_st8_1_0_, ordermaste0_.pay_status as pay_stat9_1_0_, ordermaste0_.update_time as update_10_1_0_ from order_master ordermaste0_ where ordermaste0_.order_id=?
一条链路请求里面只有1个reaceId,order服务是调用product服务的,那么product服务是否也是拥有此traceId,我们在product服务也加上服务追踪的sleuth
我们用postman再次请求1次: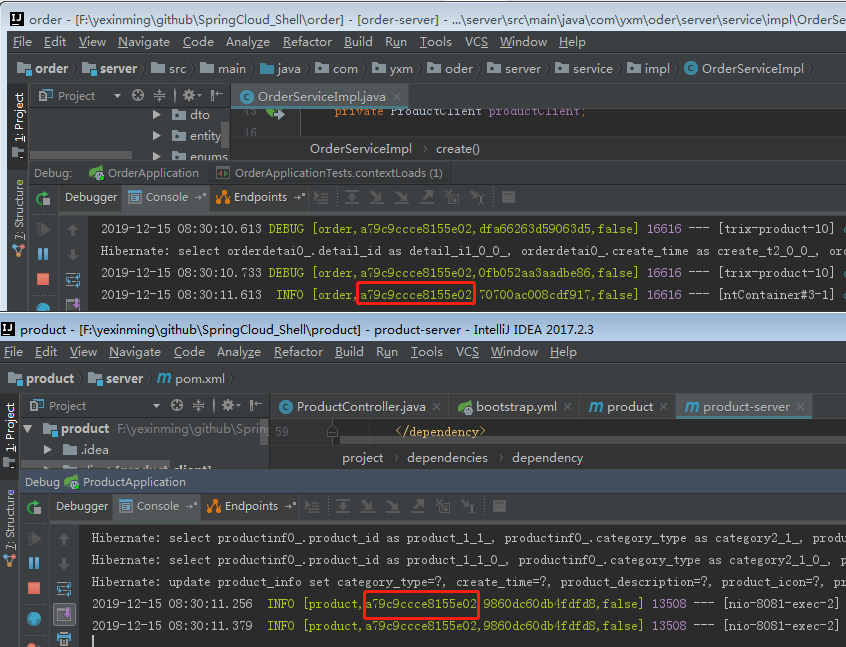
现在指标已经出来了,但是我们不可能一直在控制台上看,我们需要友好的,有计划的展示出来。这里我们用到Zipkin框架展示。
10.1.1 使用Zipkin
访问官网:https://zipkin.io/